ETF Portfolio Price Data
etf_prices.RdDaily adjusted closing prices for a diversified ETF portfolio. This is the
price data corresponding to etf_returns, useful for plotting
and visualization.
Format
A matrix with approximately 1,750 rows (trading days) and 5 columns:
- SPY
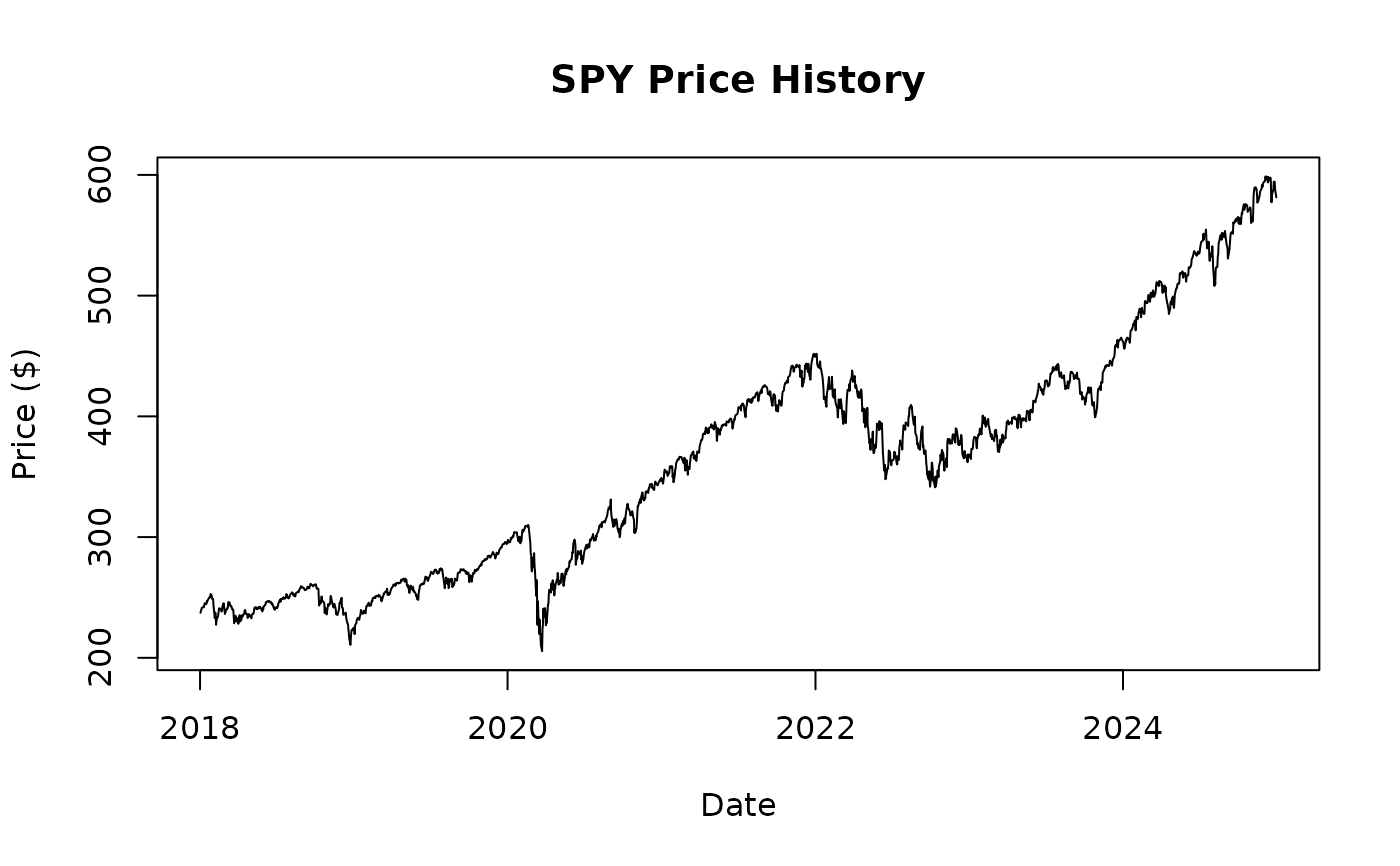
S&P 500 ETF adjusted close price
- EFA
iShares MSCI EAFE ETF adjusted close price
- BND
Vanguard Total Bond Market ETF adjusted close price
- GLD
SPDR Gold Shares ETF adjusted close price
- VNQ
Vanguard Real Estate ETF adjusted close price
The matrix has the following attributes:
- dates
Date vector of trading days
- symbols
Character vector of ticker symbols
See also
etf_returns for the corresponding returns data.